Terpenes

Universität Bonn
This thematic issue is dedicated to Prof. Kenji Mori who passed away on April 16, 2019. With him the scientific community lost one of the most eminent pheromone and terpene chemists of the past decades. Prof. Mori has published more than 1,200 scientific articles and was actively engaged in science for more than 62 years. He pioneered the importance of chirality in natural signalling compounds and was most respected for his accuracy in this field of research. Prof. Mori's work will be continued by his countless students, collaborators from academia and industry, and many researchers worldwide that have been influenced by him.

New sesquiterpenoids from the South China Sea soft corals Clavularia viridis and Lemnalia flava
- Qihao Wu,
- Yuan Gao,
- Meng-Meng Zhang,
- Li Sheng,
- Jia Li,
- Xu-Wen Li,
- Hong Wang and
- Yue-Wei Guo
Beilstein J. Org. Chem. 2019, 15, 695–702, doi:10.3762/bjoc.15.64


An efficient synthesis of the guaiane sesquiterpene (−)-isoguaiene by domino metathesis
- Yuzhou Wang,
- Ahmed F. Darweesh,
- Patrick Zimdars and
- Peter Metz
Beilstein J. Org. Chem. 2019, 15, 858–862, doi:10.3762/bjoc.15.83


New terpenoids from the fermentation broth of the edible mushroom Cyclocybe aegerita
- Frank Surup,
- Florian Hennicke,
- Nadine Sella,
- Maria Stroot,
- Steffen Bernecker,
- Sebastian Pfütze,
- Marc Stadler and
- Martin Rühl
Beilstein J. Org. Chem. 2019, 15, 1000–1007, doi:10.3762/bjoc.15.98


Mechanistic investigations on multiproduct β-himachalene synthase from Cryptosporangium arvum
- Jan Rinkel and
- Jeroen S. Dickschat
Beilstein J. Org. Chem. 2019, 15, 1008–1019, doi:10.3762/bjoc.15.99


Phylogenomic analyses and distribution of terpene synthases among Streptomyces
- Lara Martín-Sánchez,
- Kumar Saurabh Singh,
- Mariana Avalos,
- Gilles P. van Wezel,
- Jeroen S. Dickschat and
- Paolina Garbeva
Beilstein J. Org. Chem. 2019, 15, 1181–1193, doi:10.3762/bjoc.15.115


Molecular basis for the plasticity of aromatic prenyltransferases in hapalindole biosynthesis
- Takayoshi Awakawa and
- Ikuro Abe
Beilstein J. Org. Chem. 2019, 15, 1545–1551, doi:10.3762/bjoc.15.157


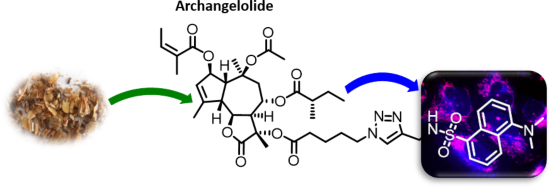
Archangelolide: A sesquiterpene lactone with immunobiological potential from Laserpitium archangelica
- Silvie Rimpelová,
- Michal Jurášek,
- Lucie Peterková,
- Jiří Bejček,
- Vojtěch Spiwok,
- Miloš Majdl,
- Michal Jirásko,
- Miloš Buděšínský,
- Juraj Harmatha,
- Eva Kmoníčková,
- Pavel Drašar and
- Tomáš Ruml
Beilstein J. Org. Chem. 2019, 15, 1933–1944, doi:10.3762/bjoc.15.189


Analysis of sesquiterpene hydrocarbons in grape berry exocarp (Vitis vinifera L.) using in vivo-labeling and comprehensive two-dimensional gas chromatography–mass spectrometry (GC×GC–MS)
- Philipp P. Könen and
- Matthias Wüst
Beilstein J. Org. Chem. 2019, 15, 1945–1961, doi:10.3762/bjoc.15.190


Isolation and characterisation of irinans, androstane-type withanolides from Physalis peruviana L.
- Annika Stein,
- Dave Compera,
- Bianka Karge,
- Mark Brönstrup and
- Jakob Franke
Beilstein J. Org. Chem. 2019, 15, 2003–2012, doi:10.3762/bjoc.15.196


Bipolenins K–N: New sesquiterpenoids from the fungal plant pathogen Bipolaris sorokiniana
- Chin-Soon Phan,
- Hang Li,
- Simon Kessler,
- Peter S. Solomon,
- Andrew M. Piggott and
- Yit-Heng Chooi
Beilstein J. Org. Chem. 2019, 15, 2020–2028, doi:10.3762/bjoc.15.198


Genome mining in Trichoderma viride J1-030: discovery and identification of novel sesquiterpene synthase and its products
- Xiang Sun,
- You-Sheng Cai,
- Yujie Yuan,
- Guangkai Bian,
- Ziling Ye,
- Zixin Deng and
- Tiangang Liu
Beilstein J. Org. Chem. 2019, 15, 2052–2058, doi:10.3762/bjoc.15.202


Harnessing enzyme plasticity for the synthesis of oxygenated sesquiterpenoids
- Melodi Demiray,
- David J. Miller and
- Rudolf K. Allemann
Beilstein J. Org. Chem. 2019, 15, 2184–2190, doi:10.3762/bjoc.15.215


Isolation of fungi using the diffusion chamber device FIND technology
- Benjamin Libor,
- Henrik Harms,
- Stefan Kehraus,
- Ekaterina Egereva,
- Max Crüsemann and
- Gabriele M. König
Beilstein J. Org. Chem. 2019, 15, 2191–2203, doi:10.3762/bjoc.15.216


Current understanding and biotechnological application of the bacterial diterpene synthase CotB2
- Ronja Driller,
- Daniel Garbe,
- Norbert Mehlmer,
- Monika Fuchs,
- Keren Raz,
- Dan Thomas Major,
- Thomas Brück and
- Bernhard Loll
Beilstein J. Org. Chem. 2019, 15, 2355–2368, doi:10.3762/bjoc.15.228


Synthetic terpenoids in the world of fragrances: Iso E Super® is the showcase
- Alexey Stepanyuk and
- Andreas Kirschning
Beilstein J. Org. Chem. 2019, 15, 2590–2602, doi:10.3762/bjoc.15.252


Nanangenines: drimane sesquiterpenoids as the dominant metabolite cohort of a novel Australian fungus, Aspergillus nanangensis
- Heather J. Lacey,
- Cameron L. M. Gilchrist,
- Andrew Crombie,
- John A. Kalaitzis,
- Daniel Vuong,
- Peter J. Rutledge,
- Peter Turner,
- John I. Pitt,
- Ernest Lacey,
- Yit-Heng Chooi and
- Andrew M. Piggott
Beilstein J. Org. Chem. 2019, 15, 2631–2643, doi:10.3762/bjoc.15.256


Emission and biosynthesis of volatile terpenoids from the plasmodial slime mold Physarum polycephalum
- Xinlu Chen,
- Tobias G. Köllner,
- Wangdan Xiong,
- Guo Wei and
- Feng Chen
Beilstein J. Org. Chem. 2019, 15, 2872–2880, doi:10.3762/bjoc.15.281


Bacterial terpene biosynthesis: challenges and opportunities for pathway engineering
- Eric J. N. Helfrich,
- Geng-Min Lin,
- Christopher A. Voigt and
- Jon Clardy
Beilstein J. Org. Chem. 2019, 15, 2889–2906, doi:10.3762/bjoc.15.283


